

VOSviewer Software
VOSviewer software is a vital tool primarily used to construct bibliometric networks based on a specific type of scientific source. The program is especially helpful for analyzing the connections among various types of papers, journals, keywords, authors, and topics.
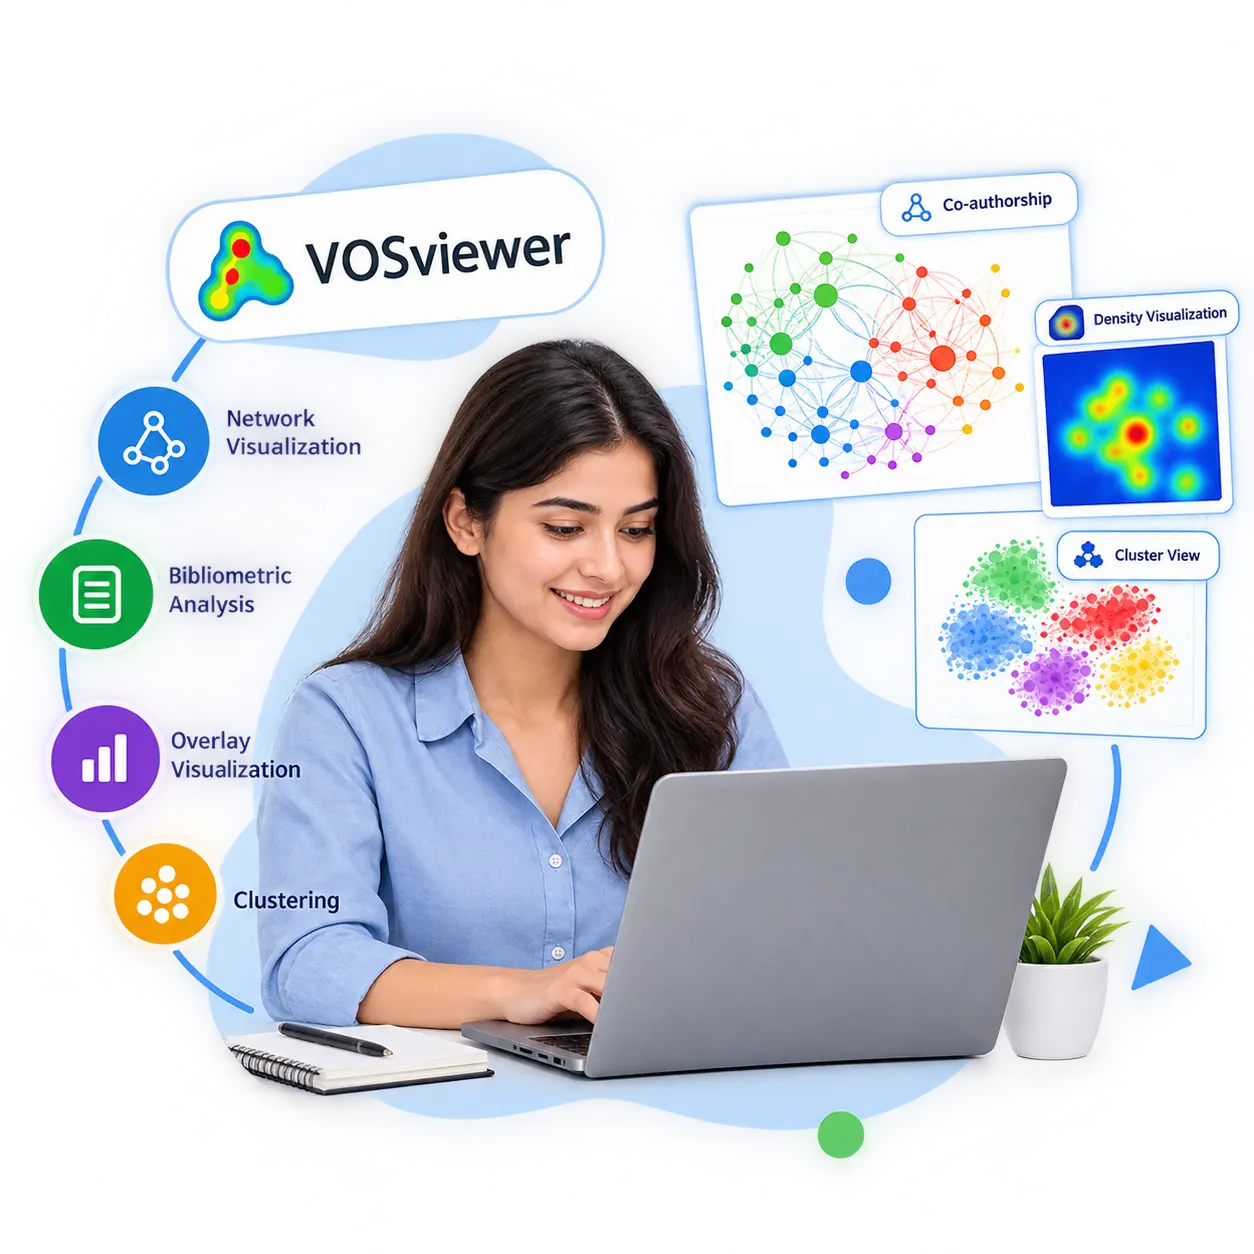
At HIGS Software Solutions, we offer VOSviewer implementation and research support services to PhD scholars, researchers, academic institutions, and research projects. Our experts can help you convert your bibliographic and research data into a comprehensive visual map of relationships that highlights key areas, topics, emerging trends, patterns of collaboration, and other valuable information.
What is VOSviewer?
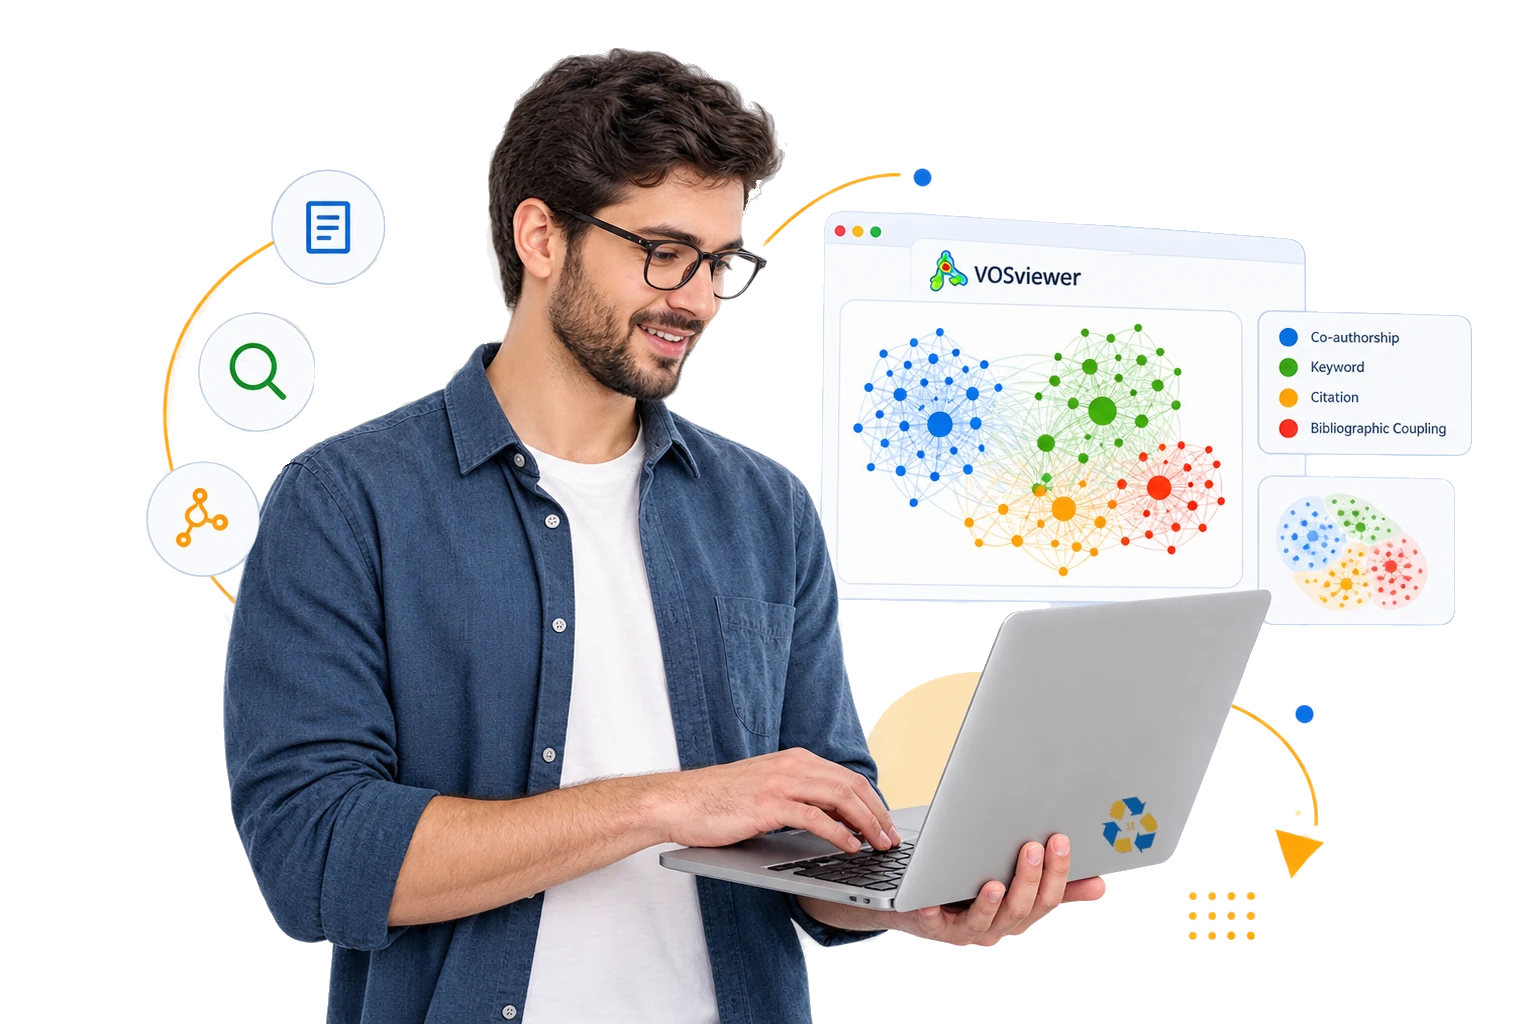
VOSviewer is a bibliometric visualization tool used to create and explore scientific networks, including co-authorship, citation, keyword, co-citation, and bibliographic coupling relationships.
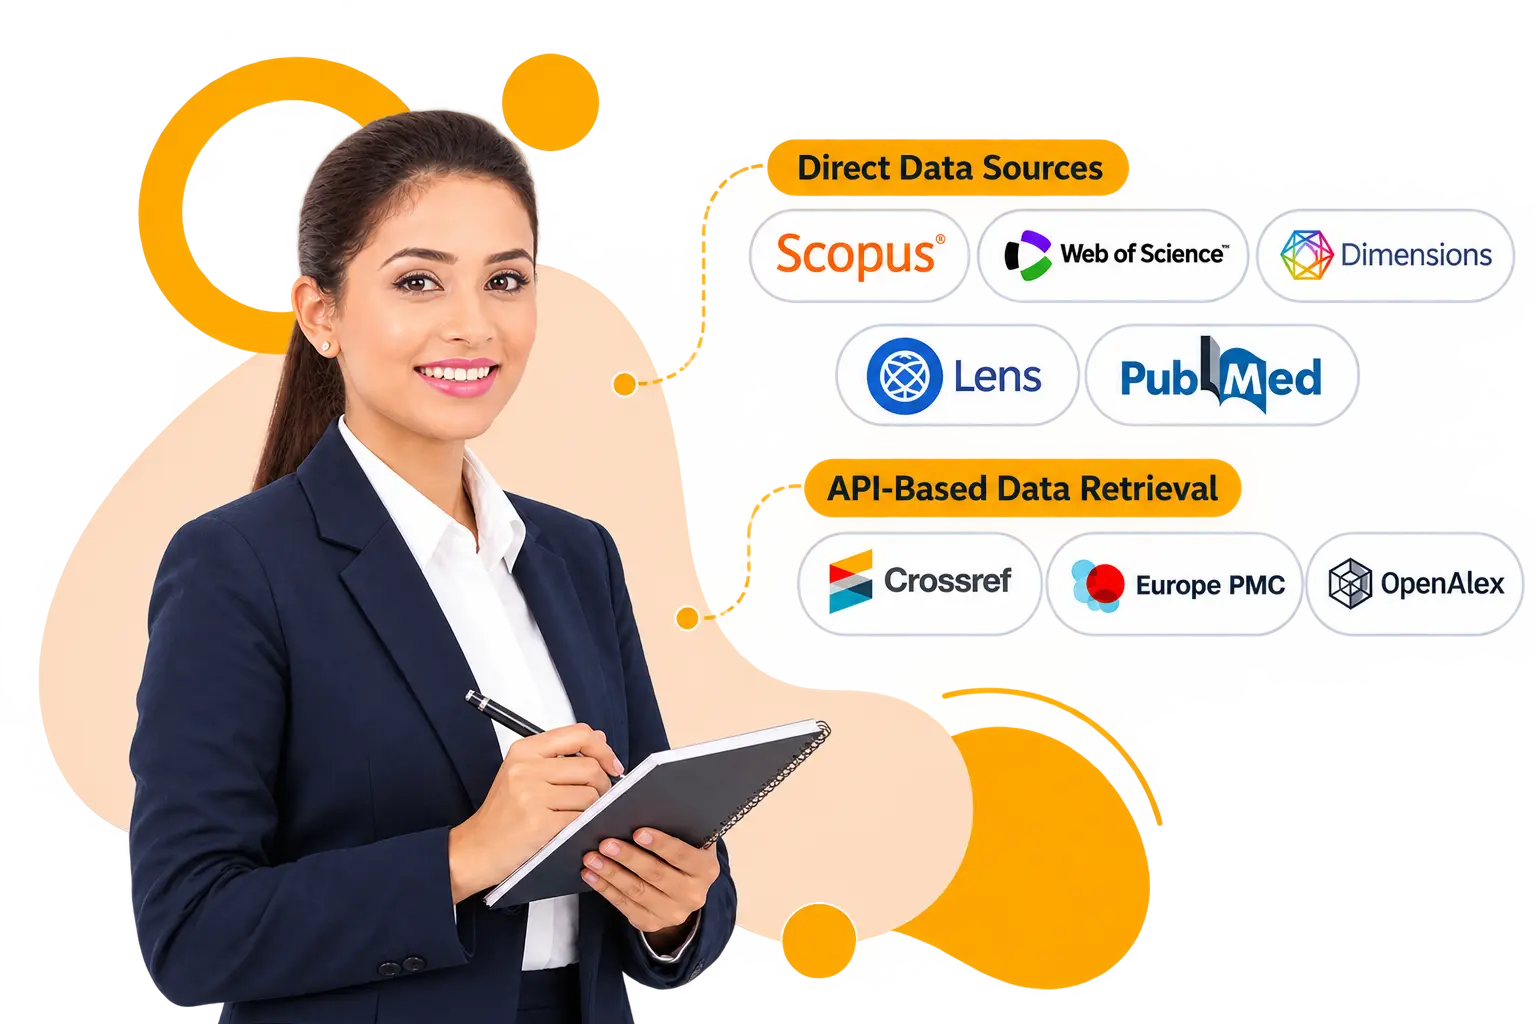
VOSviewer can work with data from sources such as Scopus, Web of Science, Dimensions, Lens, and PubMed, while API- based data retrieval is also available for sources including Crossref, Europe PMC, and OpenAlex.
Expert support for VOSviewer and bibliometric analysis
Turn your bibliographic data into clear and meaningful research insights with HIGS Software Solution Pvt Ltd. Our experts provide VOS software implementation and VOSviewer analysis support for PhD scholars, researchers, academicians, and students.
Transform Your Research with Expert VOSviewer Analysis
- ✓ VOS Software Implementation
- ✓ VOSviewer Analysis Services
- ✓ Bibliometric Analysis Support
VOS Viewer Bibliometric analysis
VOSviewer bibliometric analysis can help researchers understand the structure and development of a research field. By visualizing relationships within a dataset, researchers can identify closely related research themes and examine how different authors, publications, keywords, or journals are connected.
For example, a keyword co-occurrence map can reveal groups of terms that frequently appear together, while a co-authorship map can highlight collaboration patterns among researchers. VOSviewer visualizations use characteristics such as item size, link strength, distance, and cluster color to help users interpret relationships within a network.
Our VOSviewer Implementation Process
Research Requirement Analysis
We understand your research topic, objectives, methodology, and the type of bibliometric analysis required.
Data Collection & Preparation
Relevant bibliographic data is prepared from supported research databases and sources.
Data Cleaning & Structuring
The dataset is reviewed and organized to improve the quality and consistency of the VOSviewer analysis.
VOSviewer Configuration
We configure the appropriate analysis type, counting method, thresholds, and visualization parameters according to the research requirements.
Network Map Generation
VOSviewer maps are generated to visualize relationships between keywords, authors, publications, or other selected entities.
Cluster & Network Interpretation
The generated visualization is examined to identify clusters, relationships, link strength, research themes, and relevant patterns.
Research Integration
The VOSviewer outputs can be prepared for incorporation into your thesis, dissertation, research paper, systematic literature review, or bibliometric study.
VOSviewer Analysis We Implement
Use VOSviewer visualizations to strengthen literature reviews, bibliometric studies and research trend analysis.
Keyword Co-Occurrence Analysis
Identify frequently occurring keywords and visualize relationships between research terms. This can help researchers discover major research themes, related concepts, and emerging areas of study.
Co-Authorship Analysis
Analyze collaboration patterns between researchers, organizations, or countries. The resulting network can help demonstrate research collaboration and scholarly connections.
Research Trend Mapping
Use VOSviewer visualization to examine changing research themes and identify areas receiving increasing research attention.
Co-Citation Analysis
Analyze publications, authors, or journals that are frequently cited together to understand intellectual relationships within a research field.
Bibliographic Coupling
Identify publications that share common references and visualize groups of closely related research.
Citation Analysis
Create citation-based networks to examine relationships between publications and identify influential research within a selected dataset.
VOSviewer for Literature Review
VOSviewer can be particularly useful for researchers conducting extensive literature reviews. Instead of presenting only a conventional narrative summary, researchers can use bibliometric visualization to demonstrate how research topics, keywords, publications, and authors are interconnected.
Our team can help implement VOSviewer for literature review, including keyword mapping, research cluster identification, publication analysis, and visualization of research landscapes.
VOSviewer for Research Trend Analysis
Understanding how a research field develops over time can support better research positioning and topic identification. VOSviewer can be used to visualize research networks and investigate relationships within large collections of scientific publications.
We can implement VOSviewer research trend analysis to help researchers examine established themes, connected research areas, and potential emerging directions.
VOSviewer Implementation for PhD Research
Our VOSviewer implementation service helps researchers use bibliometric visualization effectively within their research methodology. We assist with the complete workflow, from preparing bibliographic datasets to generating and interpreting VOSviewer maps.
Our implementation support can include:
- Bibliographic data preparation
- Scopus data analysis
- Web of Science data analysis
- Keyword co-occurrence analysis
- Co-authorship network analysis
- Citation network analysis
- Co-citation analysis
- Bibliographic coupling
- Research trend visualization
- Cluster analysis
- Research topic mapping
- Publication network visualization
- Author & institution collaboration mapping
- VOSviewer map generation
- Network interpretation and reporting
VOSviewer Software Support for Researchers
At HIGS, our VOSviewer implementation support is designed around your specific research requirements rather than simply generating a standard map. We focus on selecting an appropriate analysis approach, preparing the dataset, generating meaningful visualizations, and helping you understand how the results relate to your research objectives.
What Can We Analyze?
Our VOSviewer analysis can help you explore:
- Keyword Co-occurrence – Identify frequently occurring keywords and discover connections between research topics.
- Co-authorship Networks – Visualize collaboration patterns among researchers, authors, institutions, or countries.
- Citation Analysis – Identify highly cited publications and understand citation relationships.
- Co-citation Analysis – Discover publications, authors, or sources that are frequently cited together.
- Bibliographic Coupling – Identify publications that share common references and reveal related research areas.
- Research Trend Analysis – Track emerging topics and changing research interests over time.
- Cluster Analysis – Group related keywords, publications, or research elements into meaningful thematic clusters.
- Network Visualization – Generate network, overlay, and density visualizations for easier interpretation of research relationships.
Frequently Asked Questions
Quick answers about VOSviewer and our implementation support.
VOSviewer is used to construct and visualize bibliometric networks, including keywords, citations, co-citations, co-authorship and bibliographic coupling.
VOSviewer is freely available software developed by the Centre for Science and Technology Studies (CWTS) at Leiden University.
Yes. VOSviewer supports bibliographic data exported from Scopus, as well as several other compatible sources and formats.
Yes. It supports bibliometric studies, literature analysis, research trends, keyword analysis and network-based research activities.
Yes. HIGS provides support for data preparation, VOSviewer analysis, visualization, interpretation and research-oriented outputs based on selected requirements.